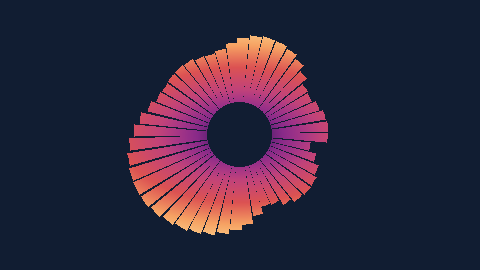
spectrum-annular-bars
radial gradient · circle/bounce motion drivers
A generated gallery of every built-in Rudiment renderer, covering classic scopes, spectrum analysers, historical time-frequency displays, polar plots and modern creative variants. All previews use deterministic synthetic test inputs.
Scientific accuracy: Spectral cards use invented, calibrated-format Fourier-band values for renderer tests. They do not depict measured music. Mel/Bark/ERB/log options remap existing band positions, not recalculate those transforms. Waveform cards show Rudiment motion channels, not PCM or stereo phase.
Source · Methods and limitations · Machine-readable catalogue
Explore element-local vs full-frame effects →
Anti-aliasing and motion blur demonstrations →
Explore sprite renderers and image atlases →
Explore particles, smoke and cue bursts →
Variable BPM & word subtitle demo →
Rich lyric typography & word sprites →
Twenty additional visual tests combine shared gradients, palettes, native DanceRudiments circle/bounce movements and independently modulated geometry and colour. Spectrum input remains invented numeric test data, not measured audio. The playback control above scrubs the exact native-driver frames.
radial gradient · circle/bounce motion drivers
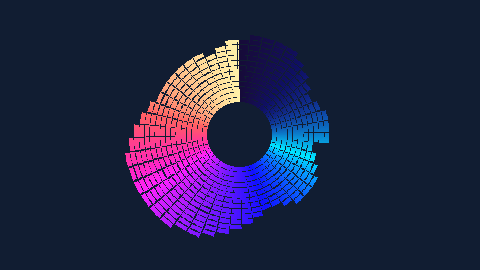
angular gradient · circle/bounce motion drivers
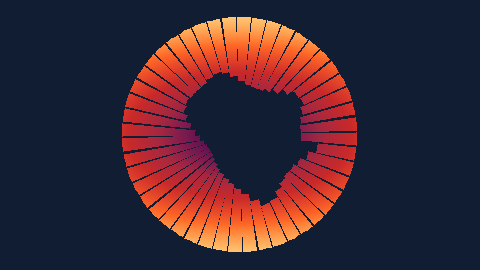
radial gradient · circle/bounce motion drivers

angular gradient · circle/bounce motion drivers

level gradient · circle/bounce motion drivers

radial gradient · circle/bounce motion drivers

angular gradient · circle/bounce motion drivers

radial gradient · circle/bounce motion drivers

angular gradient · circle/bounce motion drivers

vertical gradient · circle/bounce motion drivers
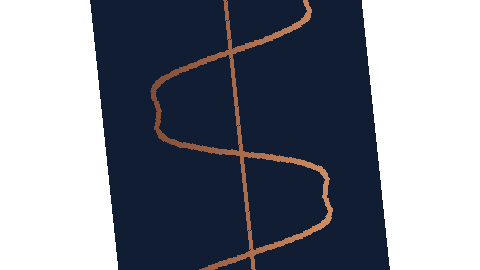
horizontal gradient · circle/bounce motion drivers
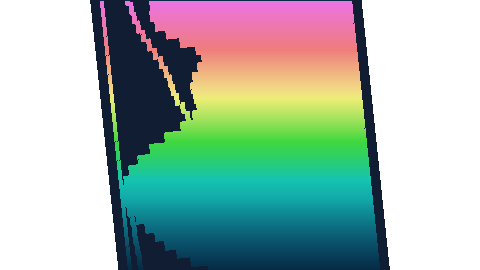
vertical gradient · circle/bounce motion drivers
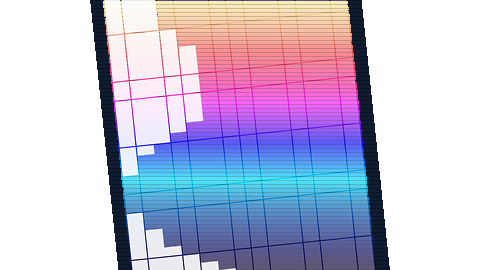
vertical gradient · circle/bounce motion drivers
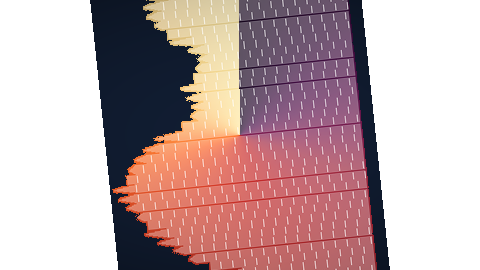
angular gradient · circle/bounce motion drivers
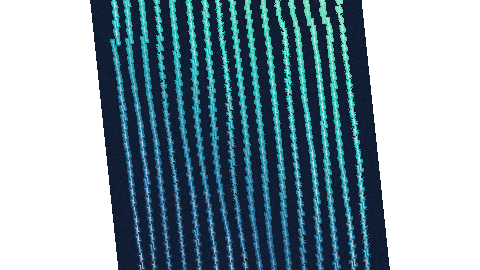
diagonal gradient · circle/bounce motion drivers
vertical gradient · circle/bounce motion drivers
horizontal gradient · circle/bounce motion drivers
angular gradient · circle/bounce motion drivers
checker gradient · circle/bounce motion drivers
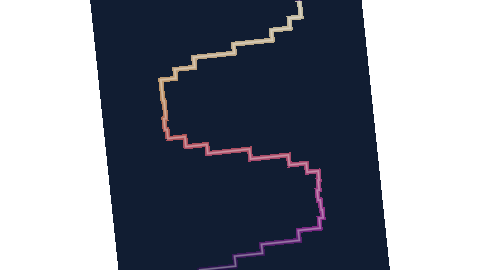
vertical gradient · circle/bounce motion drivers

Seeded particle cloud driven by sampled rudiment axes

Signed instantaneous values across rudiment axes
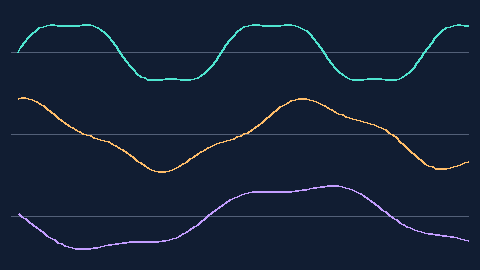
Scrolling rudiment time-domain traces
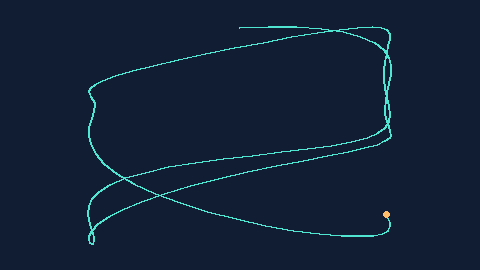
First two axes plotted as an XY motion path
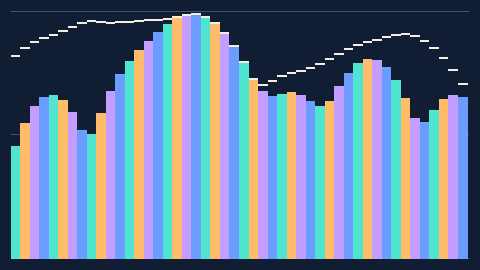
Calibrated StemLab band meter with peak holds
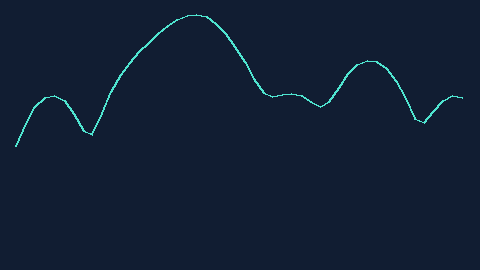
Classic connected FFT-band magnitude trace

Filled magnitude spectrum
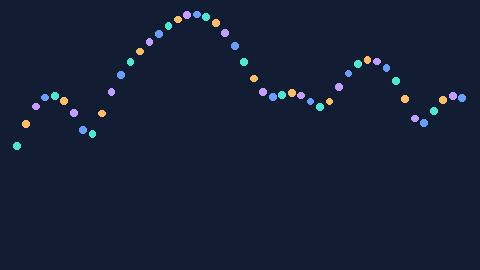
Discrete frequency-bin points
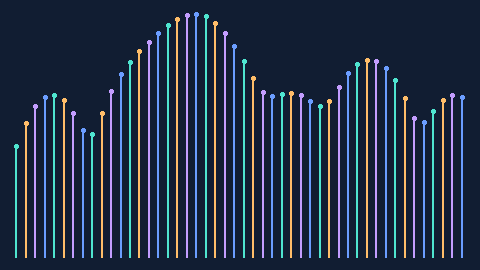
Vertical impulse / lollipop spectrum
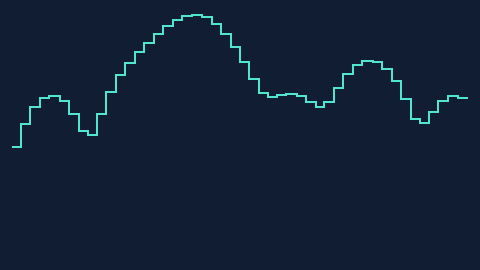
Sample-and-hold staircase bands

Mirrored upper and lower frequency spectrum

Spoke-style circular frequency bars

Radial polygon that follows spectral levels
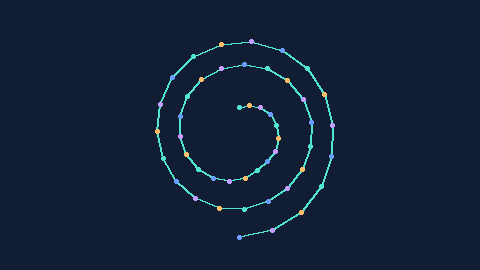
Frequency bins along a logarithmic-looking spiral path
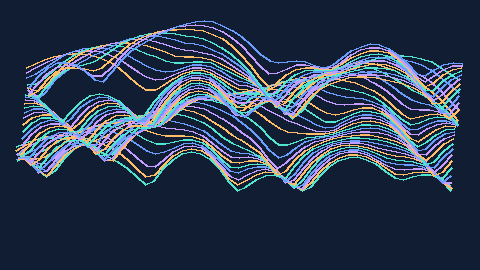
Overlaid temporal spectrum traces
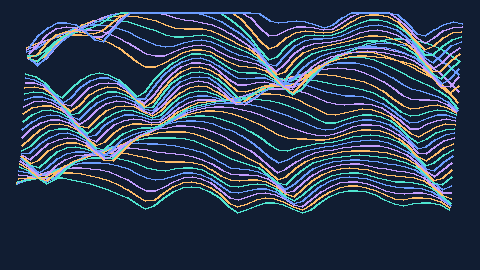
Perspective waterfall of successive band spectra
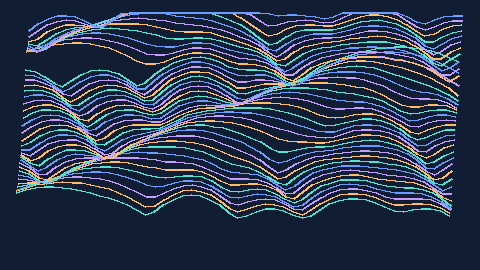
Offset stacked spectrum ridges

Local-maximum spike display
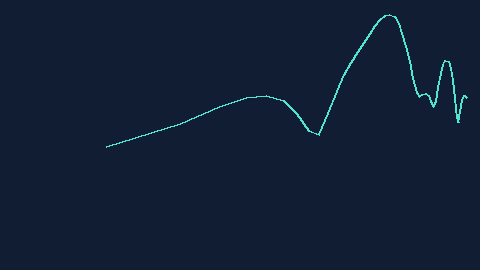
Current spectrum with a logarithmic frequency axis
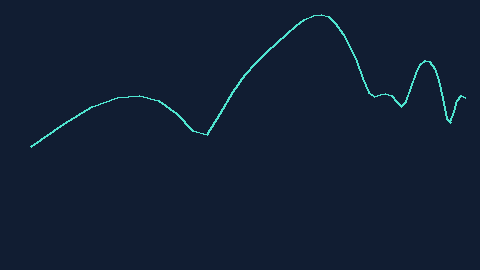
Current recorded bands positioned on a mel frequency axis
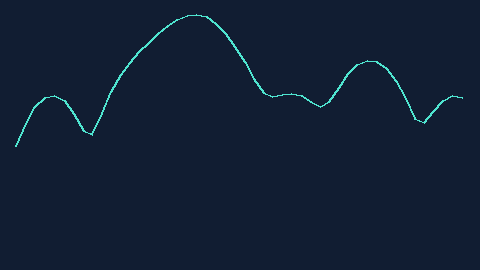
Current bands shown on a 1/3-octave frequency axis
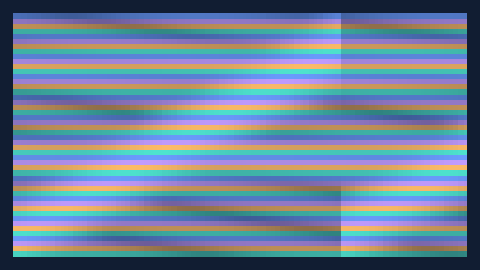
Time-frequency heatmap, linear Hz positioning
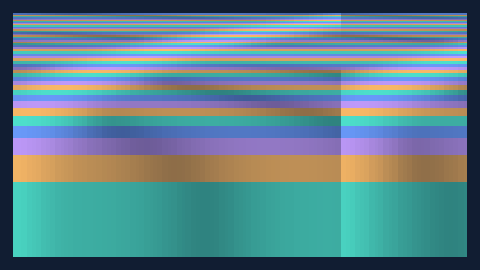
Time-frequency heatmap, logarithmic Hz positioning
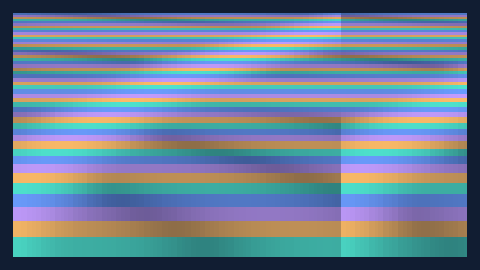
Recorded Fourier bands remapped to a mel axis
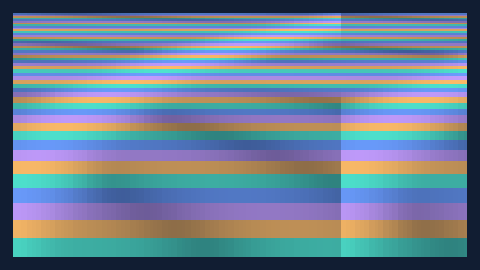
Recorded Fourier bands remapped to a Bark axis
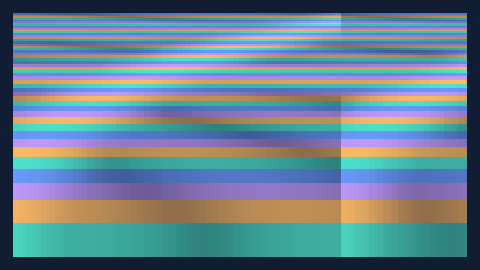
Recorded Fourier bands remapped to ERB-rate axis

Time-frequency heatmap retaining only local band maxima
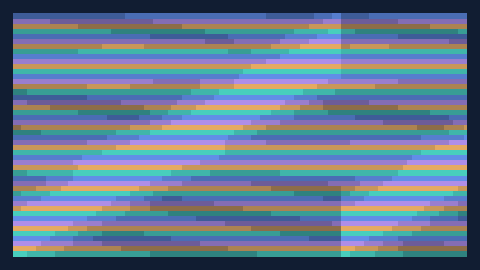
Quantised amplitude contour strips across time
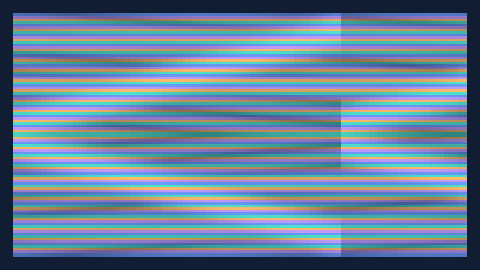
Mirrored time-frequency heatmap
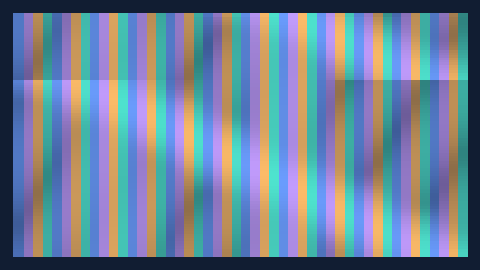
Vertical-time spectrogram / scrolling frequency history
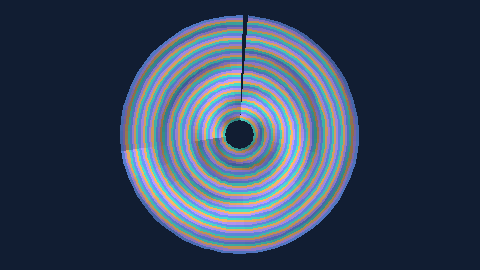
Time wrapped around angle, frequency along radius
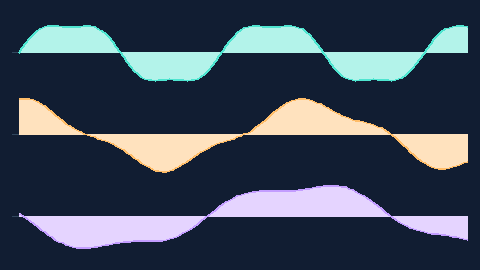
Filled multi-lane rudiment value histories

Symmetric amplitude envelope of rudiment values
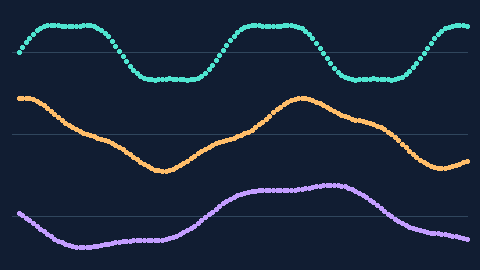
Sampled rudiment values drawn as points
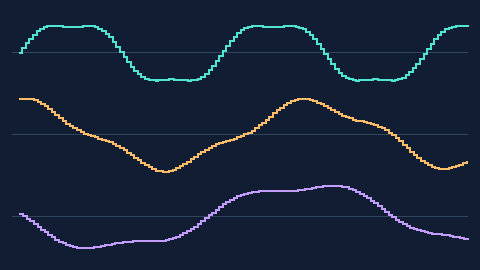
Zero-order-hold rudiment signal traces
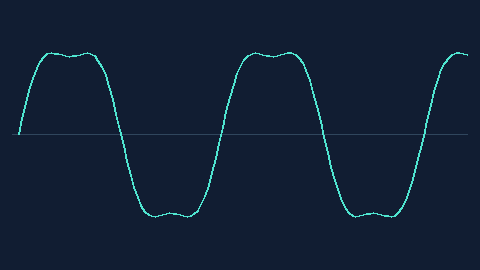
Centred scrolling single-trace rudiment oscilloscope
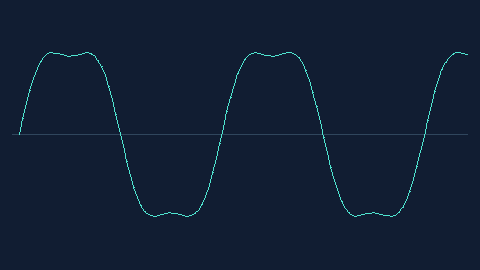
Windowed min/max envelope of observed rudiment values
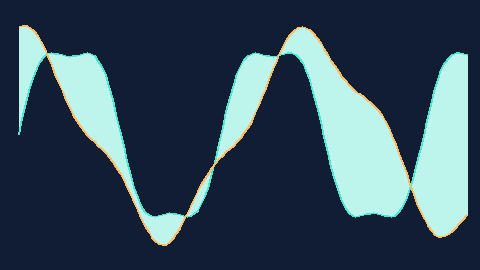
Coloured variation ribbon of paired rudiment channels

Polar history of the first rudiment channel
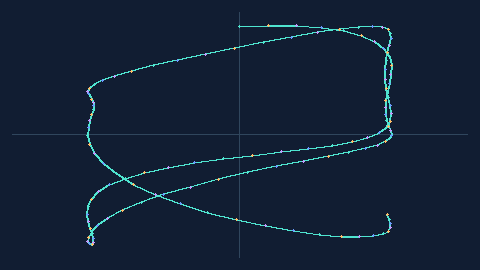
Two-dimensional history using first two motion axes
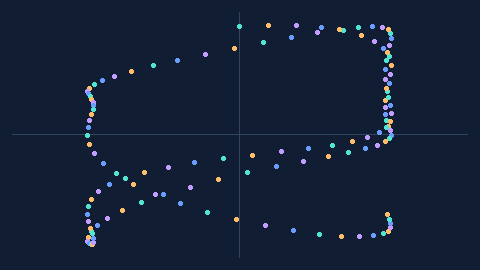
Scatter plot of paired rudiment axes

Continuous radial frequency bars rooted at the inner ring
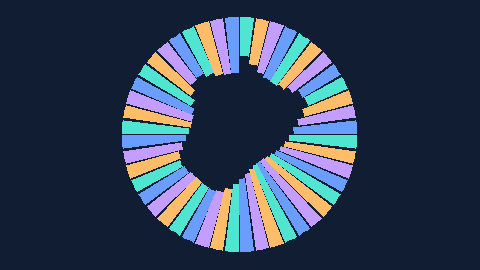
Radial bars growing inward from the outer perimeter
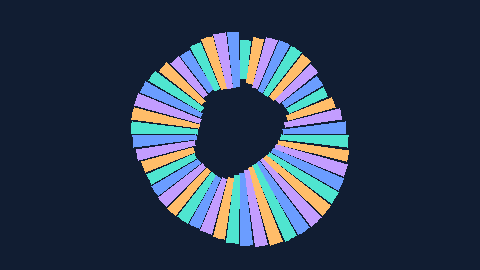
Centred, bidirectional radial magnitude bars
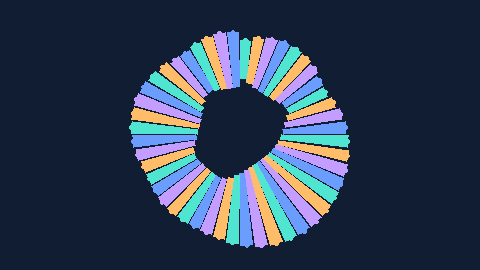
Bidirectional ring bars with endpoint markers
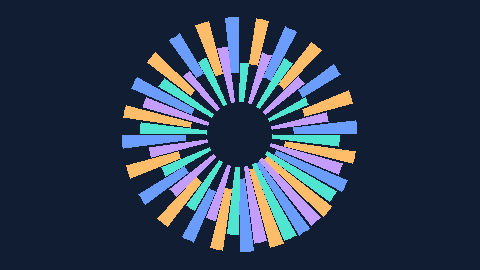
Alternating inward/outward frequency bars

Alternating-length radial sunburst analyser

Filled wedge-frequency fan analyser

Thin sector petals sized by frequency-band strength
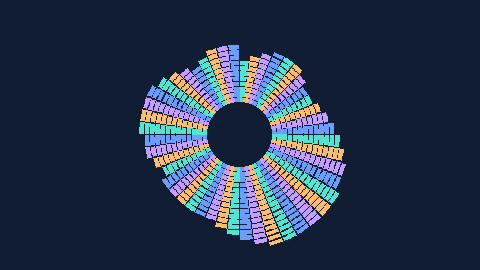
Segmented radial LED meter from inner to outer ring
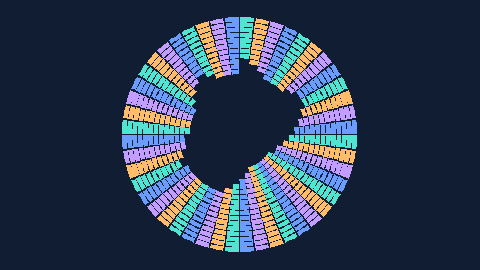
LED meter counting backwards from the outside

Isolated radial magnitude-position ticks

Concentric miniature gauge arcs for each band

Graduated frequency dial with dot-end needles

Displaced radial frequency-bin dots

Radial bar stems with circular end markers

Angularly perturbed frequency-bin orbit dots

Thick circular bead chain driven by spectral bins

Selected local maximum spectral spokes

Closed annular frequency response with filled band

Closed radial spectrum outline

Nested concentric polygon ribbons

Layered low-alpha spectral halo lines

Alternating polar rose-style magnitude petals

Multilayered frequency rings

Coloured pie sector bars per frequency bin

Interleaved bands partitioned over concentric rings

Single annular swept arc for mean visual band intensity
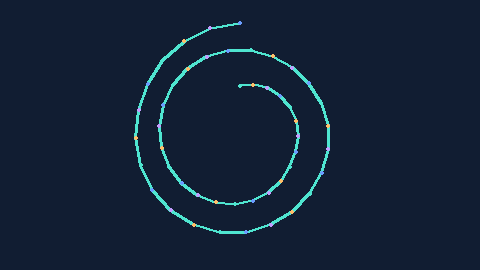
Frequency bins plotted on an amplitude-perturbed spiral
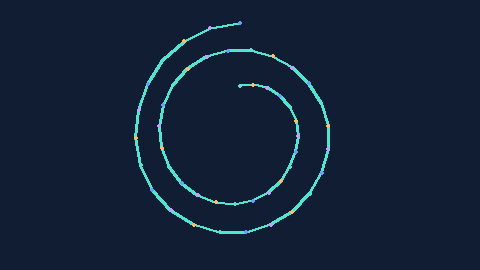
Frequency bins along a multiple-turn polar trace

Annular spectrogram with time as radius and frequency as angle
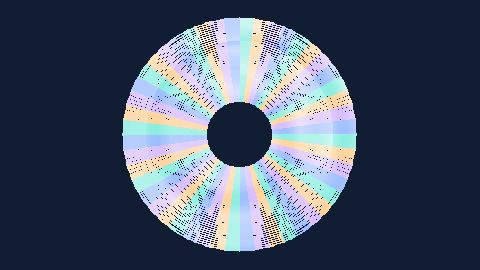
Discrete concentric time-history rings coloured by band intensity

Polar annulus time-frequency heatmap

Alternating tinted strips across the polar heatmap

Quantised spectral power annulus, band-level contour regions

Time mapped to angle, frequency to radius

Radar-style time sweep with old measurements faded

Dominant-band spectral history along a time spiral

Signed native Rudiment history as a complete annular outline

Signed annular waveform with fill to the centre ring

Filled area between motion trace and inner ring

Unsigned Rudiment channel amplitude around a circular baseline

Translucent circular waveform aura

Alternating-petal annular waveform

Per-point thickness pulse around a middle ring

Inside/outside mirrored radial waveform envelopes

Annular ribbon between two native Rudiment axes
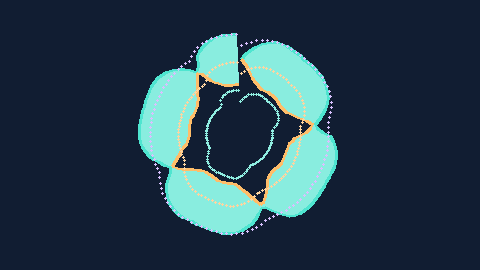
Concentric independent motion channels

Two-axis banded annular trace

Bipolar motion-history spokes rooted at a centred circle

Circular discrete-time stem oscilloscope
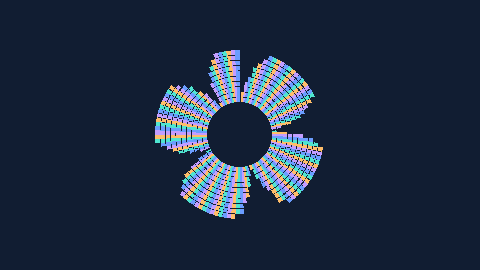
Radial LED trail driven by absolute Rudiment channel value

Sampled waveform sectors as radial petals
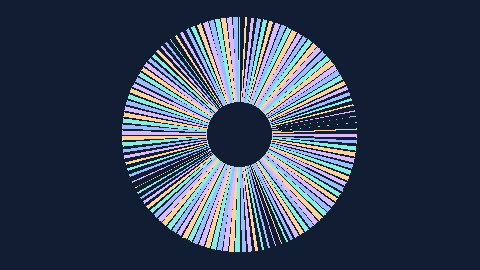
Sector length encodes absolute Rudiment motion magnitude

Time-addressed arcs with per-sample radial position

Circular sampler dots mapped to signed amplitude

Radar-like radial motion traces with dot endpoints

Chronologically fading dots along the annular waveform

Rudiment signal warped around a multi-turn time spiral

Waveform on a spiralling annular helix
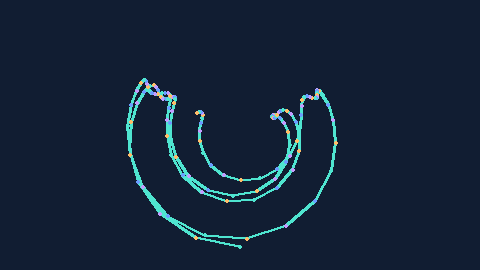
Two native Rudiment dimensions mapped into annular angle and radius
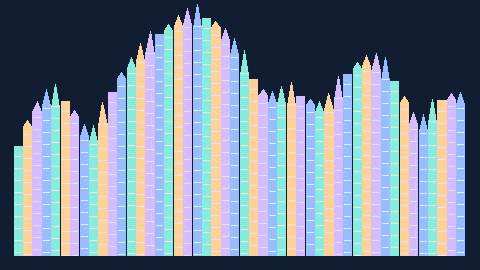
A skyline of unequal roofline bars from calibrated Fourier bands
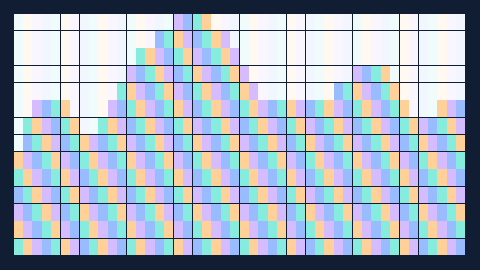
Stacked discretised LED columns across frequency
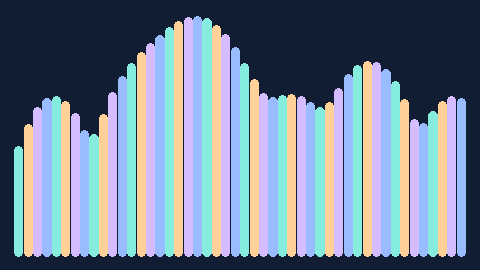
Rounded spectrum amplitude capsules
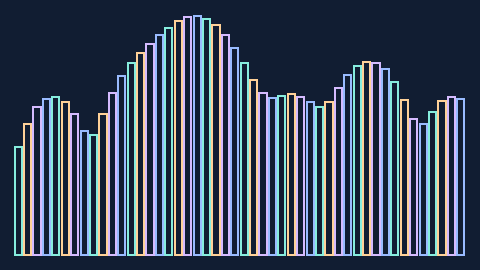
Outlined rather than filled frequency-bin rectangles
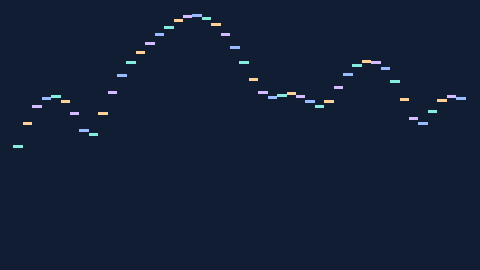
Horizontal rungs marking each calibrated band level
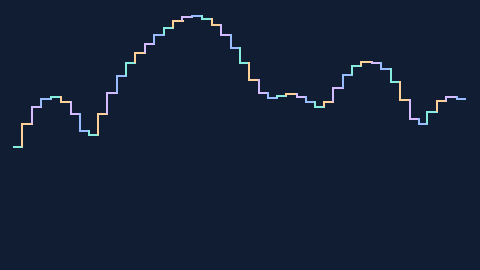
Frequency-band zero-order-hold height step plot
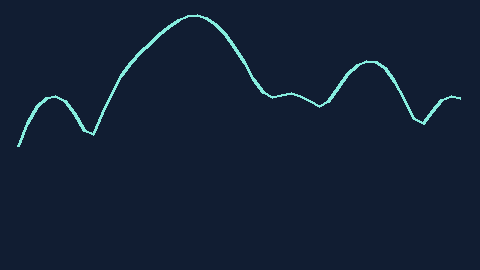
Interpolated drawing through recorded band centres (no new DSP)
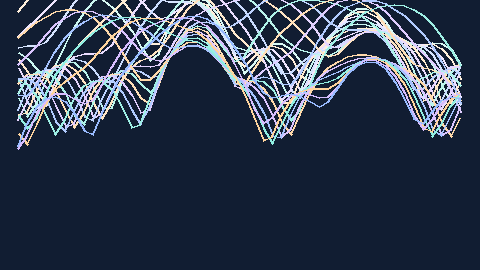
Layered observed spectral traces with fading ink

Trailing observed spectral bin markers over history
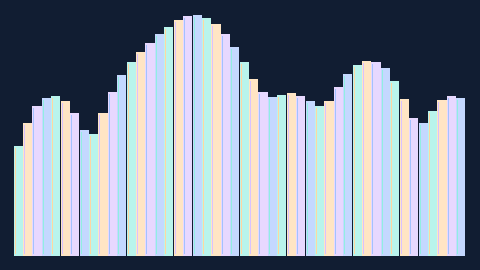
Glassy translucent frequency columns with highlights
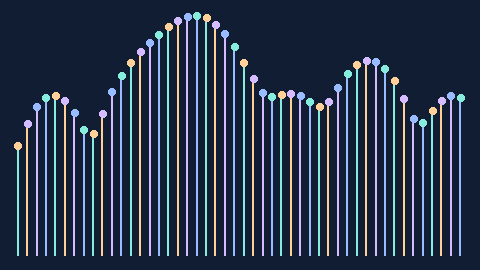
Stem-and-bead plot on a frequency grid

Ridged layers of previous frequency-band frames
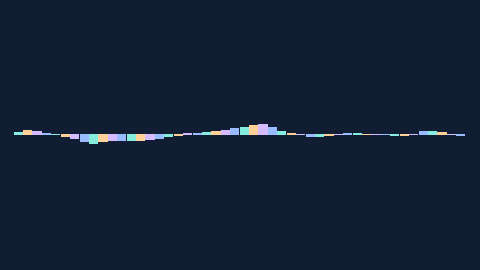
Signed difference between current and previous observed band levels
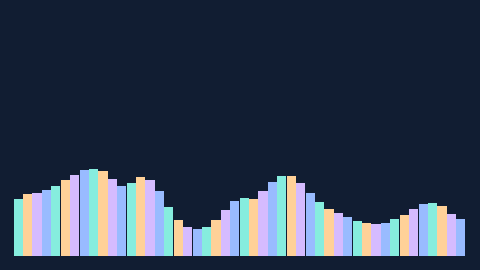
Variance of observed sampled band levels, not spectral variance analysis
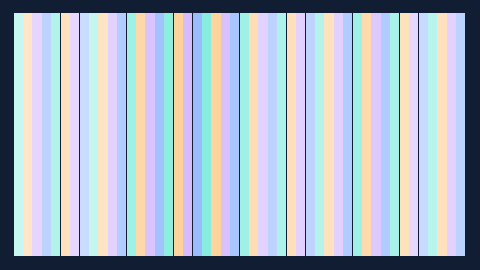
Bands drawn as colour-intensity tiles
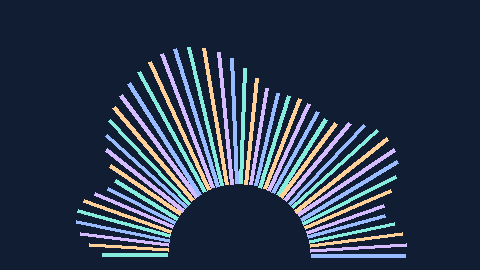
Upper semicircular spectrum bars rather than a complete annulus
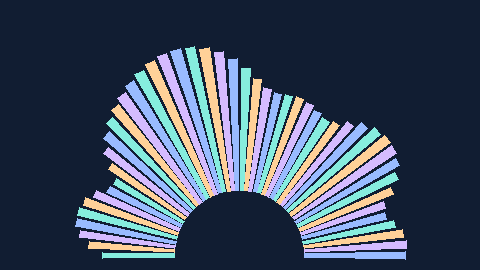
Frequency wedges along a semi-annular fan
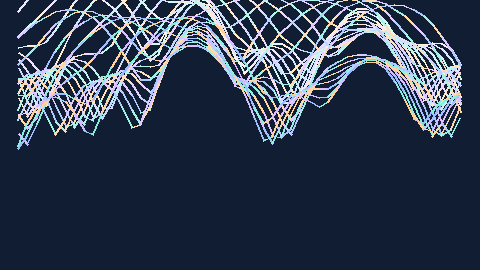
Interlaced lines from sampled band histories
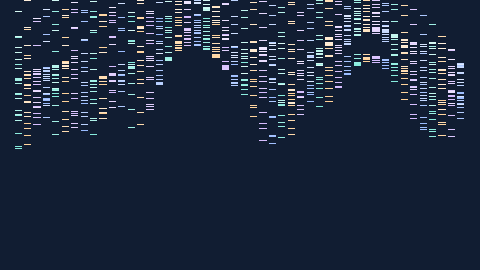
Dropping horizontal frequency strokes over sampled history
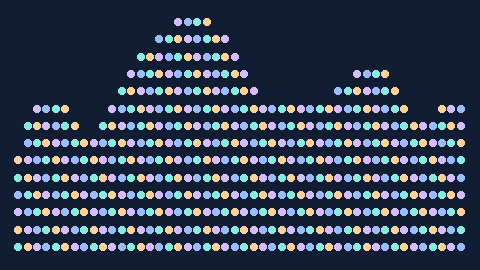
Rounded dot columns with discrete energy steps
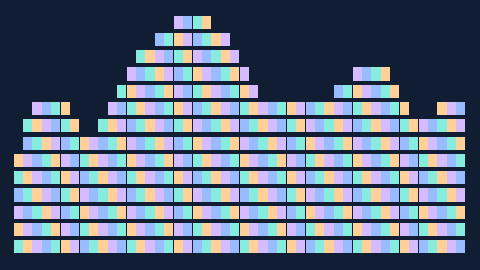
Multi-row dashed spectral equaliser
Full-height level-sensitive opacity bars
Perspective fence of successive observed spectra
Equal-width nested slices with area representing band level
Hard pixel cells showing observed time-frequency band values
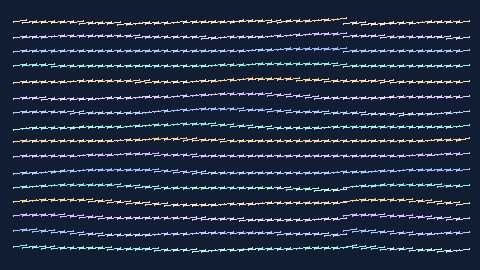
Offset isometric horizon lines over observed spectral history
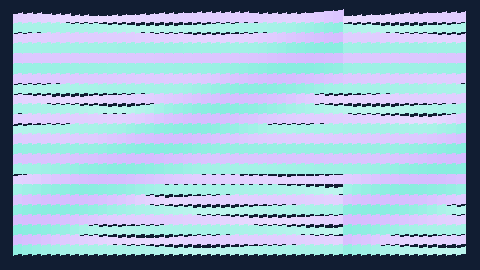
Height-encoded isometric blocks for time-frequency samples

Alternating vertical frequency columns in a scrolling heatmap
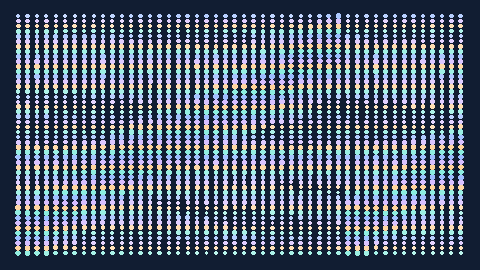
Circular marks whose radius and alpha follow observed band power
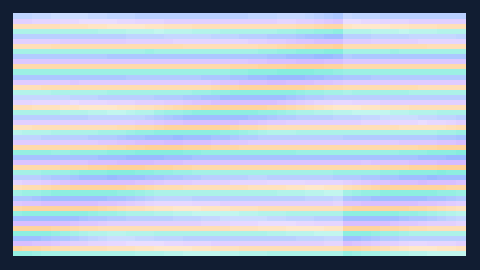
Discrete filled colour thresholds from observed bands

Inverted visual colour scale of time-frequency energy

Horizontal film-like band-history lanes
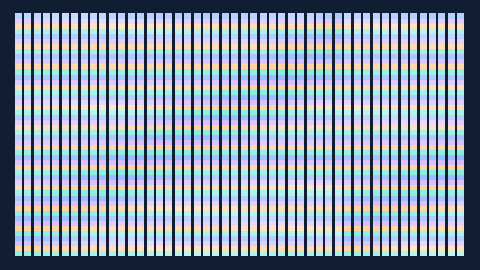
Vertical slits displaying successive spectrum samples
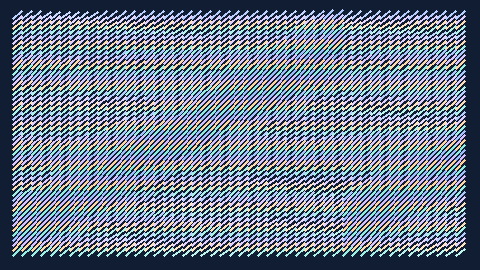
Diagonal trails of observed frequency-bin magnitudes
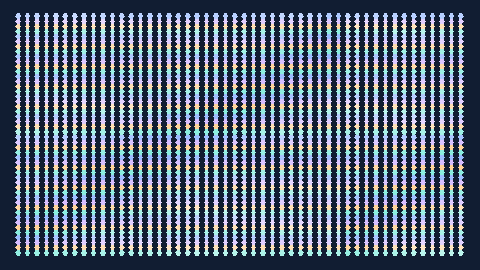
Hexagonal cells coloured by time-frequency energy
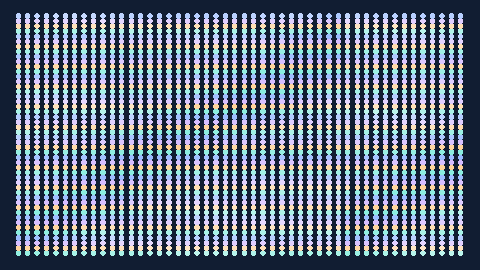
Elliptical beads arranged on time-frequency rows
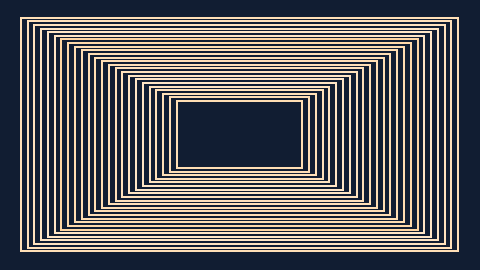
Concentric rectangular history frames with band colours
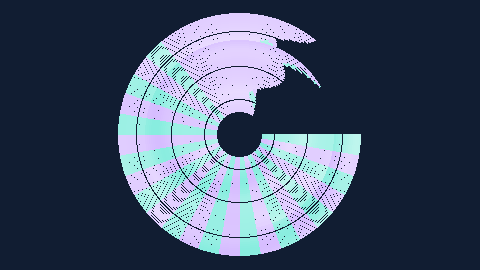
Concentric spectral history grooves in the style of a record
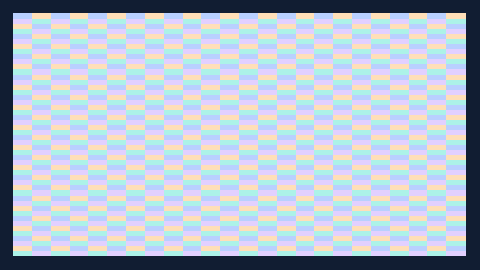
Alternating hard-edged time-frequency patches
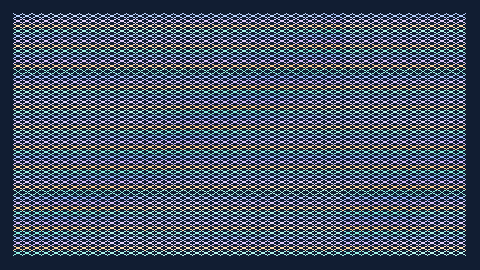
Crosshatched screen whose density follows band magnitude
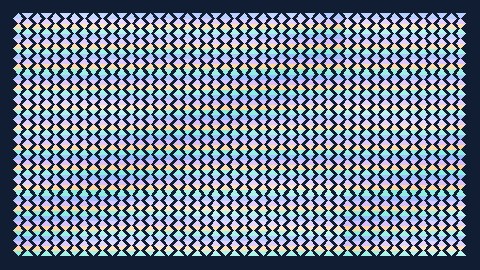
Tessellated triangle glyphs coloured by recorded spectral values
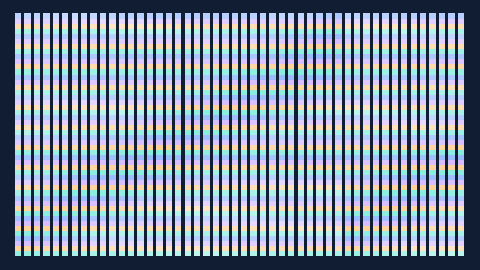
Vertical pixel drop matrix showing previous calibrated band levels
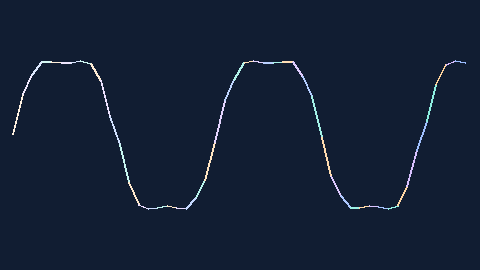
Age-decayed CRT-like sampled Rudiment trace
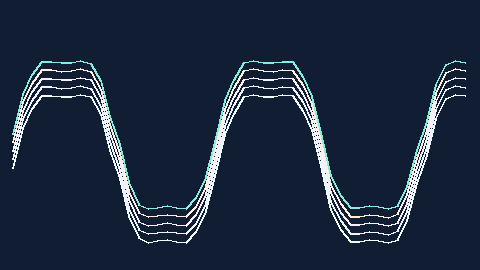
Offset translucent history echoes of Rudiment channels
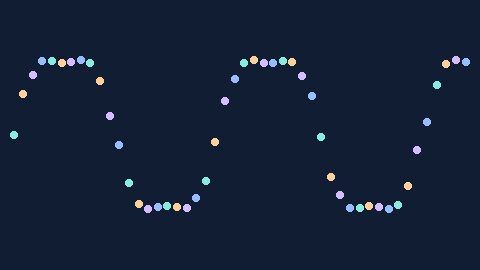
Observed Rudiment values drawn as discrete circles
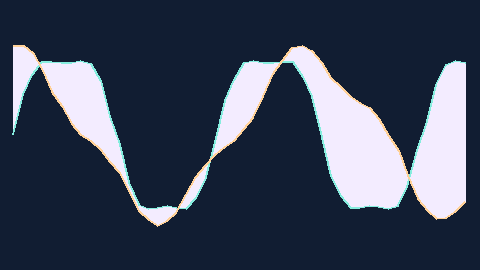
Two Rudiment dimensions woven across the time axis
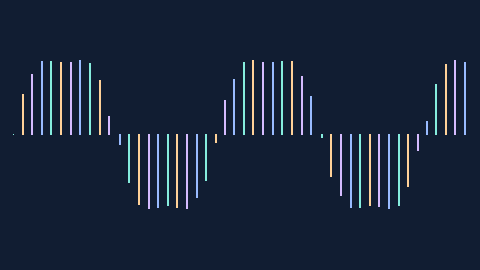
Signed Rudiment channel impulses from a zero baseline

Quantised display grid of Rudiment levels
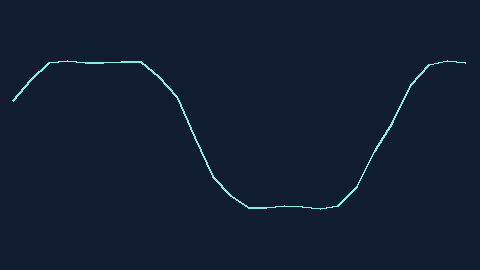
Leading-edge display aligned to an observed Rudiment zero crossing

Rudiment history rendered as a planar spiral with amplitude modulation
Mirrored paired Rudiment traces across the centre line
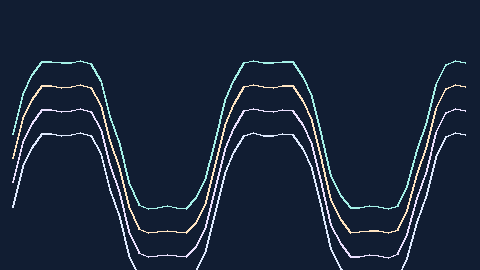
Overlaid translucent Rudiment history ridges
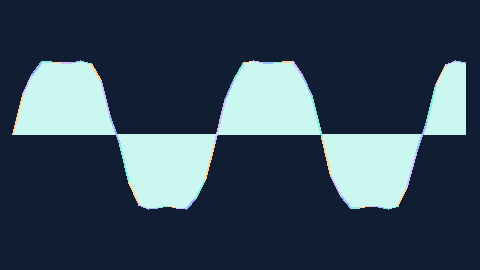
Filled channel history with time-varying ink strength
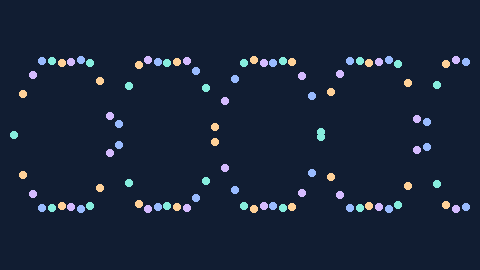
Envelope-style upper/lower sampled Rudiment point clouds
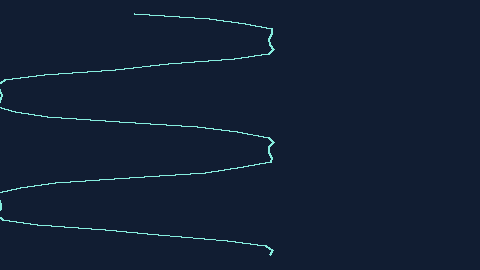
Rudiment time moving vertically with horizontal signal amplitude
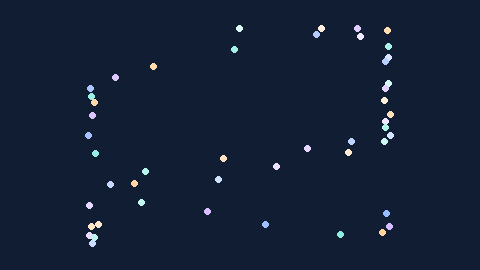
Age-faded XY Rudiment motion portrait
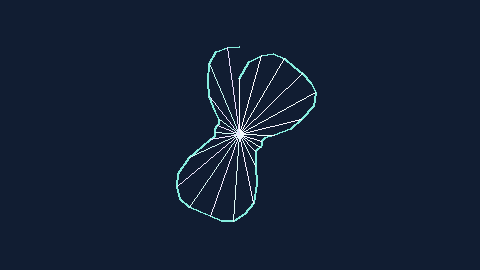
Polar motion history with fading position spokes
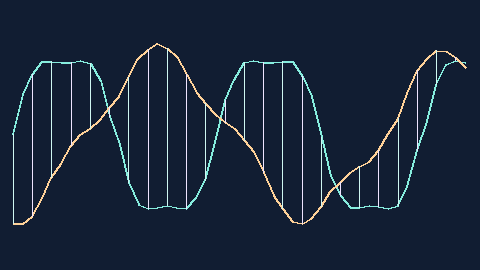
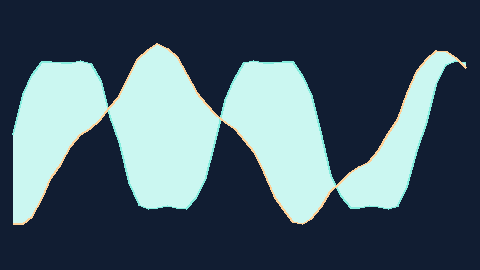
Two out-of-phase Rudiment traces linked by time-axis rungs
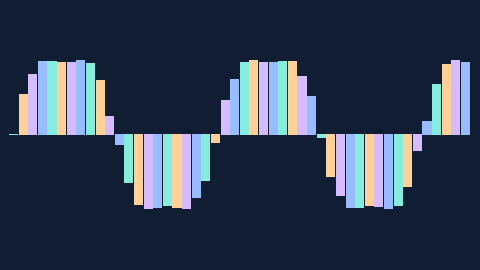
Discrete per-sample signed Rudiment blocks
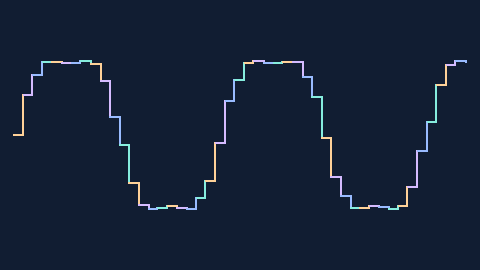
Stacked stepped traces in independently offset lanes
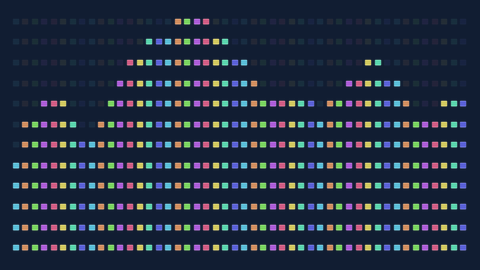
Segmented LCD level columns with lit and unlit image cells
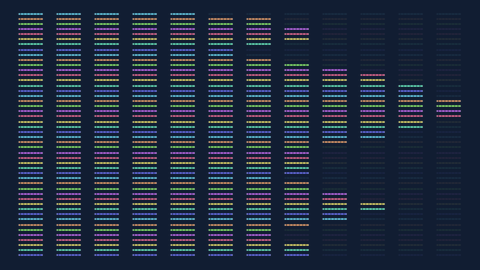
Horizontal LCD meters with independent band rows

Mirrored LCD columns growing about the centre line
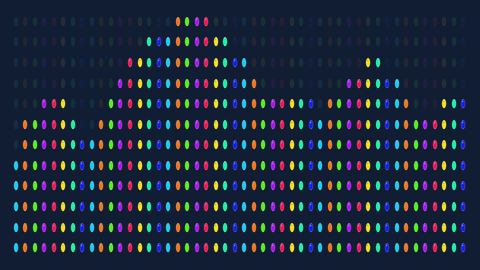
LED dot matrix with individually illuminated PNG discs

Circular LED dot analyzers built from repeated PNG stamps
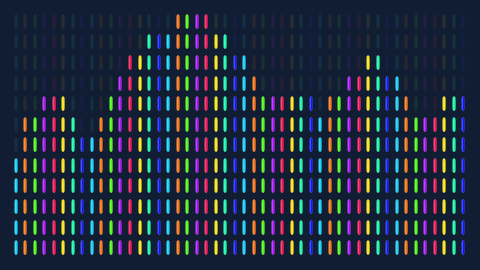
Vacuum fluorescent tube bars assembled from sprite cells
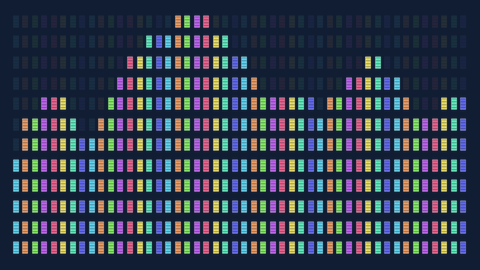
8-bit arcade frequency blocks
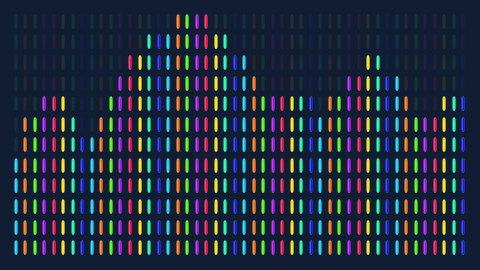
Glossy neon tube columns with sprite reflections
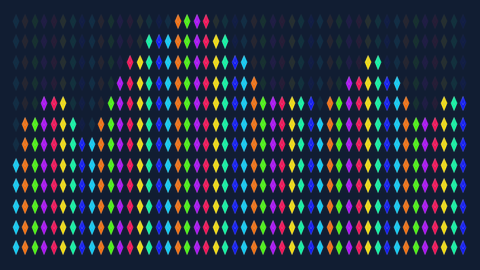
Stacked refractive crystal sprite frequency columns
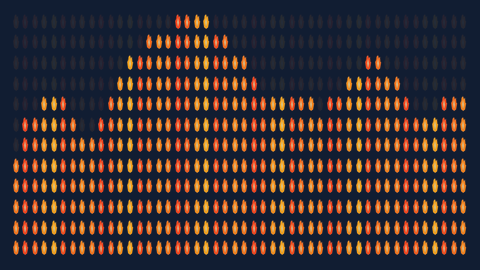
Flame sprite stacks driven by calibrated band magnitudes

Translucent frosted sprite frequency peaks
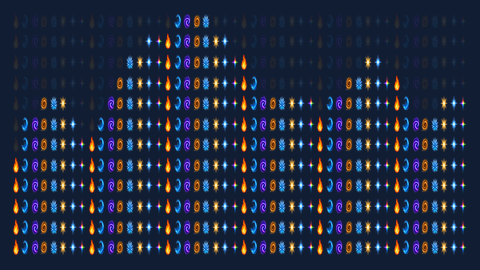
Icon-stack frequency columns

Sprite petals arranged around a circular frequency plot

Concentric sprite level rings

Soft-glow image particles around polar band positions
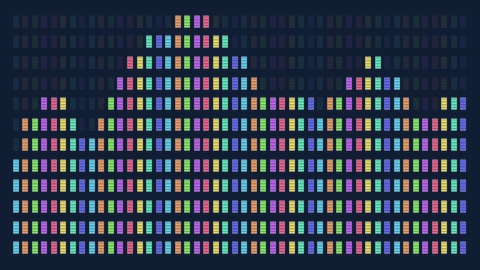
Frequency-response mosaics made from image tiles
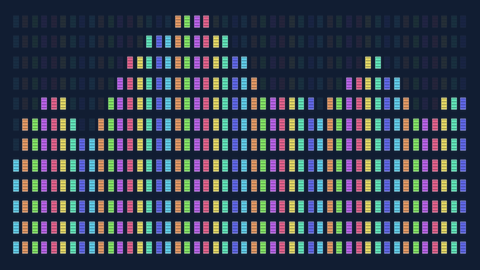
Skyline of tile-built frequency towers

Single radial sprite meter of current aggregate band level

Radial discrete frequency spokes stamped from source tiles

Orbiting glyphs at data-derived radius for each Fourier band
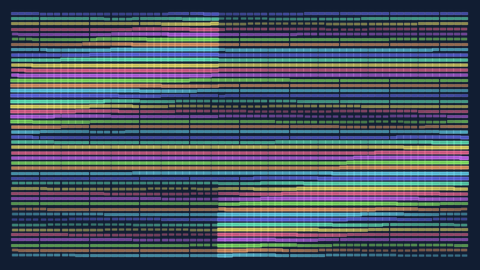
LCD segment-cell time-frequency history
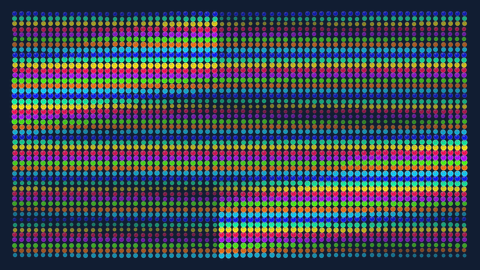
Discrete LED dot sonogram
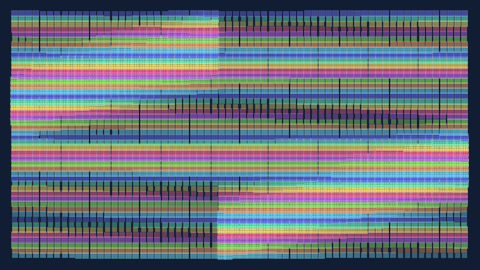
Indexed pixel tiles across observed spectrum history
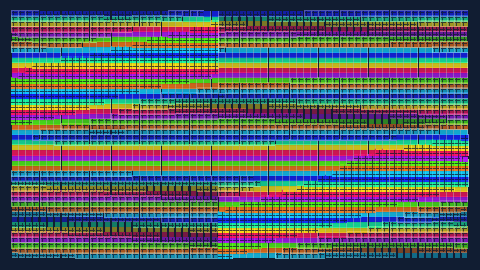
Intensity-coded bitmap cell sonogram
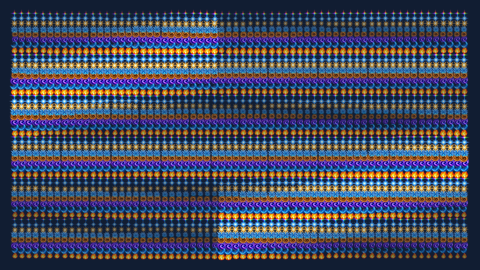
Discrete icon heatmap over observed time-frequency bins
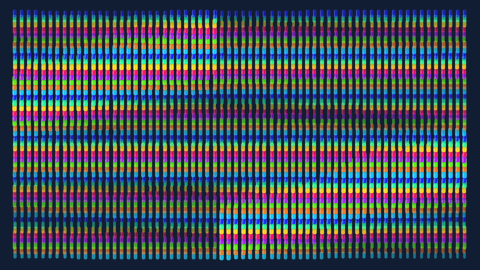
Neon time-frequency mosaic
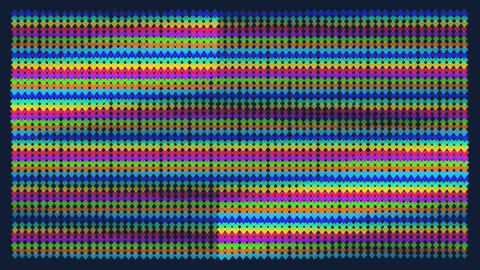
Crystal glyphs arranged by band and observed time
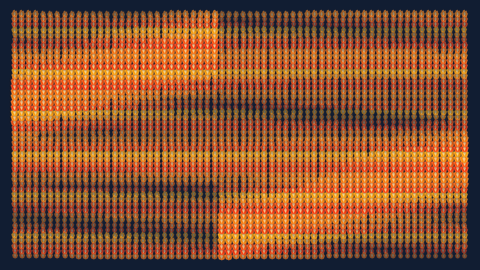
Flame sprites along energetic time-frequency regions
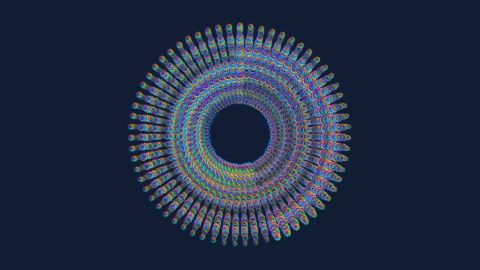
Radial annulus with frequency and time sprite positions
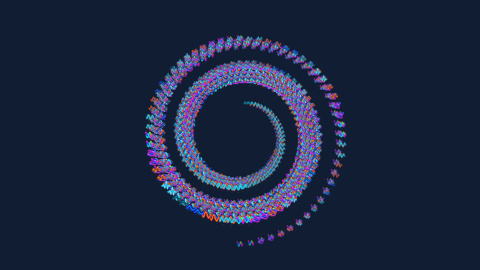
Time-wrapped sprite spiral with frequency-driven radius
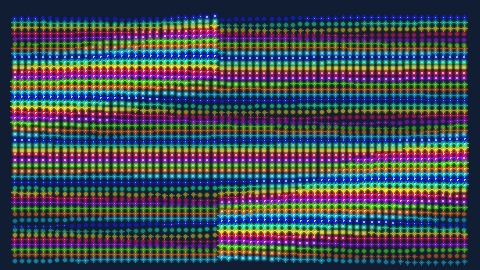
Rain-like descending trails of detected Fourier energy
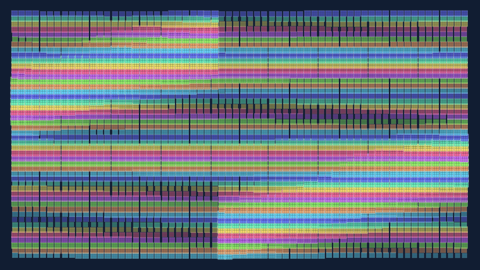
Block-cell bitmap sonogram with visible grid
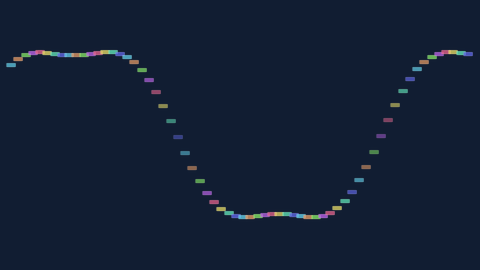
Discrete LCD cells tracing native Rudiment history
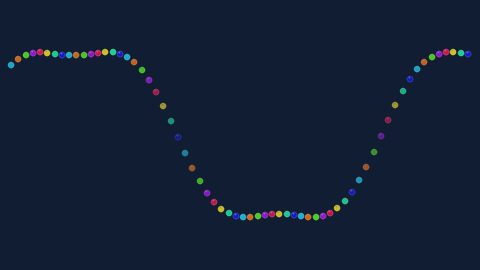
LED particles following the native waveform
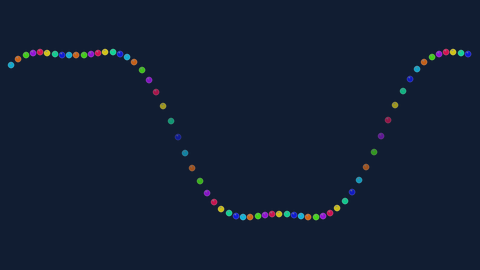
Individual sprite points for every observed sample
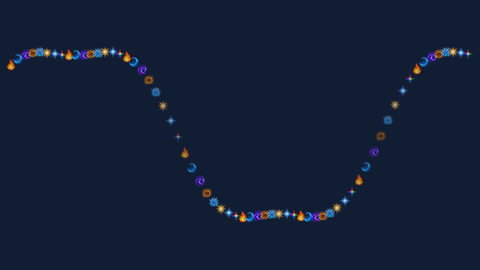
Icon stamps in chronological waveform order
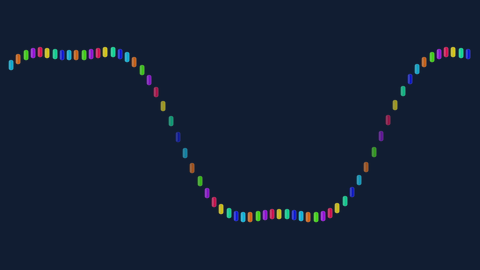
Luminous neon nodes along the native motion trace
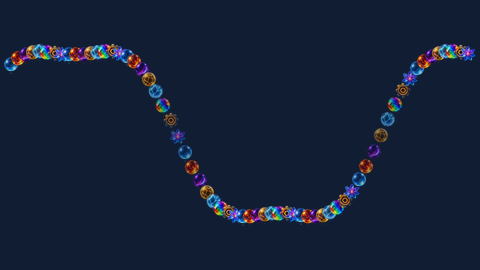
Thick image-tile waveform ribbon
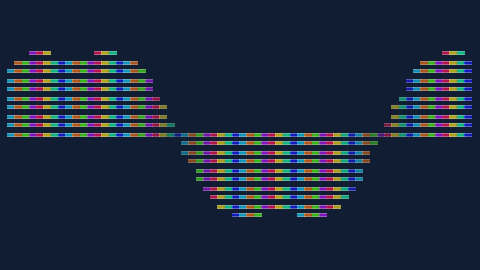
Sprite columns from the zero line to Rudiment samples
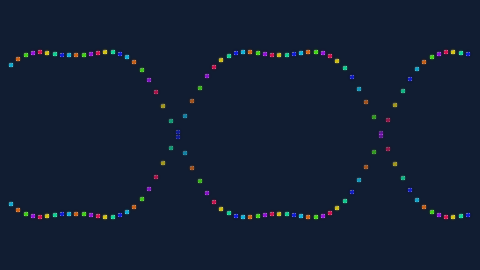
Inside/outside mirrored sprite waveform

Circular waveform built from rotating sprites

Chronological spiral sprite trail
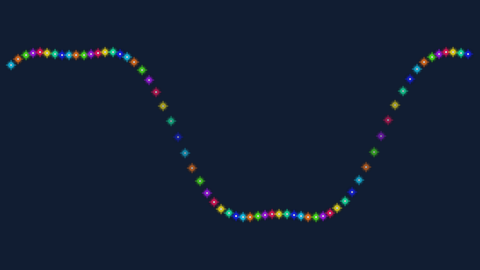
Phosphor photon sprites at sampled motion positions
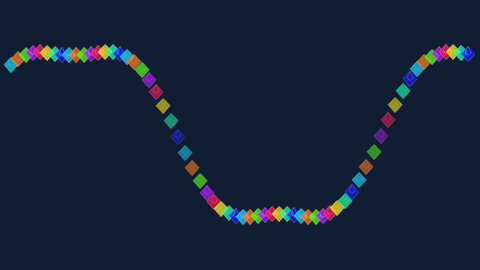
Crystal and gem glyphs following the waveform
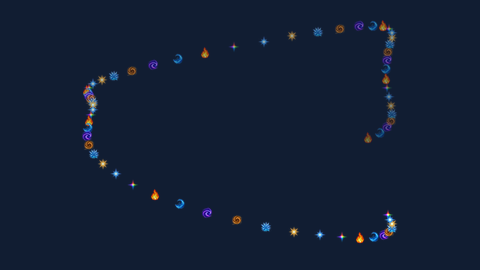
XY native Rudiment path drawn with sprite stamps
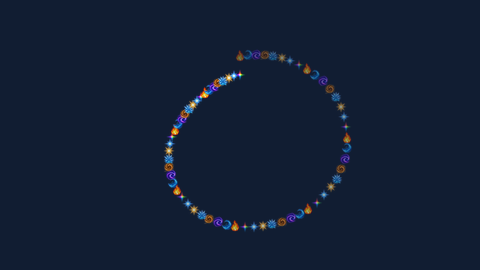
Orbiting sprite glyphs driven by two Rudiment axes
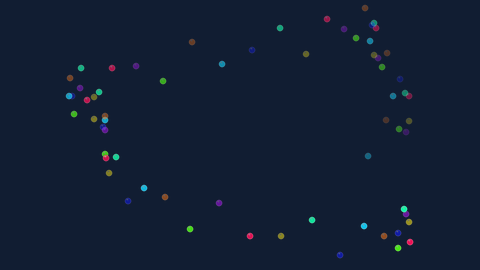
Deterministic sprite cloud around native movement
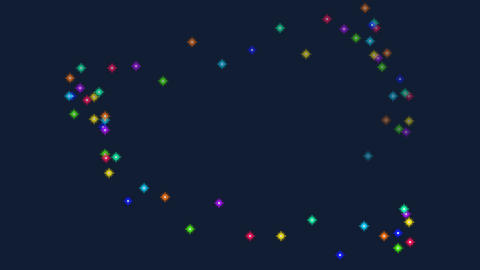
Sparse star / node sprite constellation
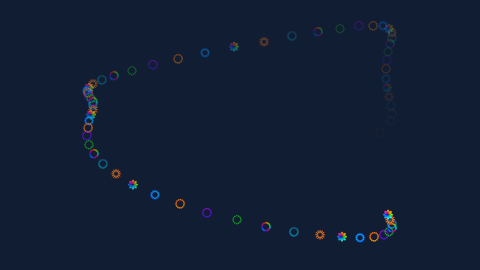
Chronological decaying motion sprite trails
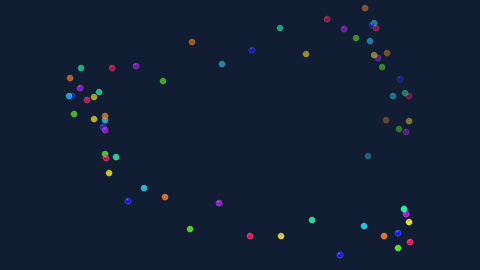
Multi-particle native motion sprite field
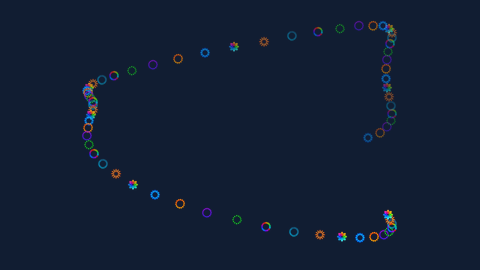
Sprite scatter for the first two native dimensions
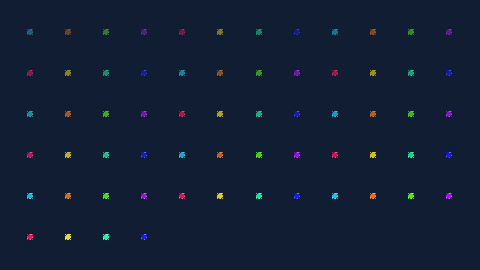
Grid of sprites responding to independent Rudiment values
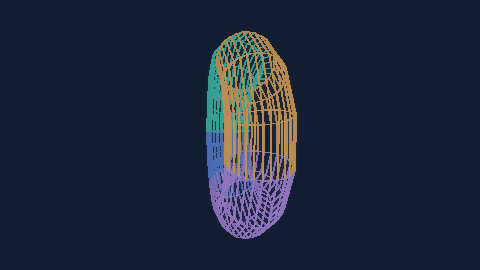
Deterministic 3D projected wire geometry animated by native Rudiment channels
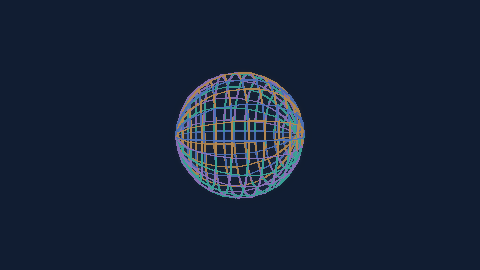
Deterministic 3D projected wire geometry animated by native Rudiment channels
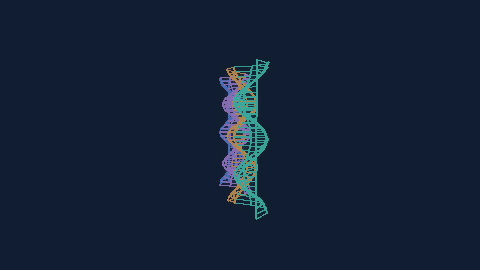
Deterministic 3D projected wire geometry animated by native Rudiment channels
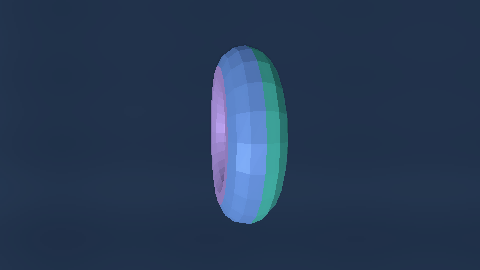
Depth-tested 3D solid mesh with directional lighting and bounded volume fog
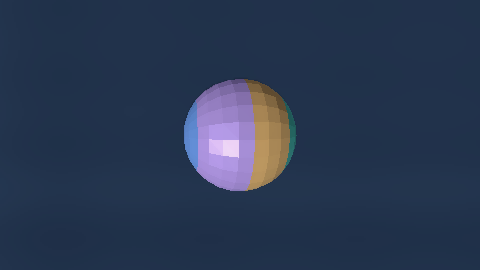
Depth-tested 3D solid mesh with directional lighting and bounded volume fog
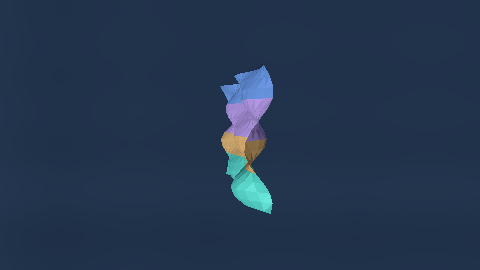
Depth-tested 3D solid mesh with directional lighting and bounded volume fog
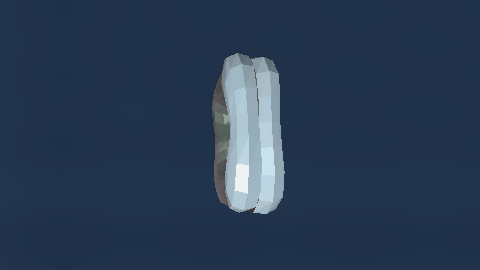
Native-motion-deformed 3D mesh with optional calibrated FFT terrain and atmospheric materials
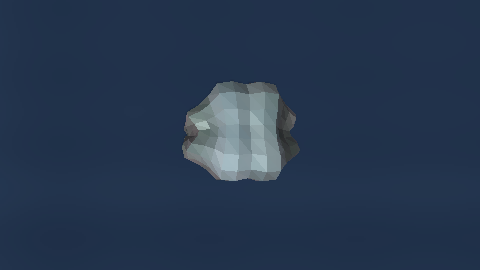
Native-motion-deformed 3D mesh with optional calibrated FFT terrain and atmospheric materials
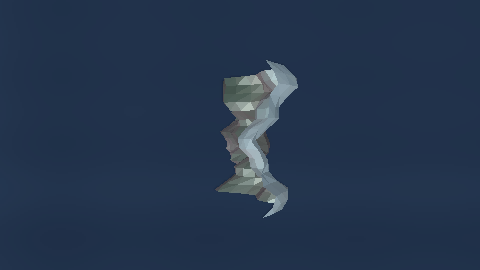
Native-motion-deformed 3D mesh with optional calibrated FFT terrain and atmospheric materials

Radial cubic Bezier petals with independent scale, spin and lift axes